
6 ANIMATIONS:
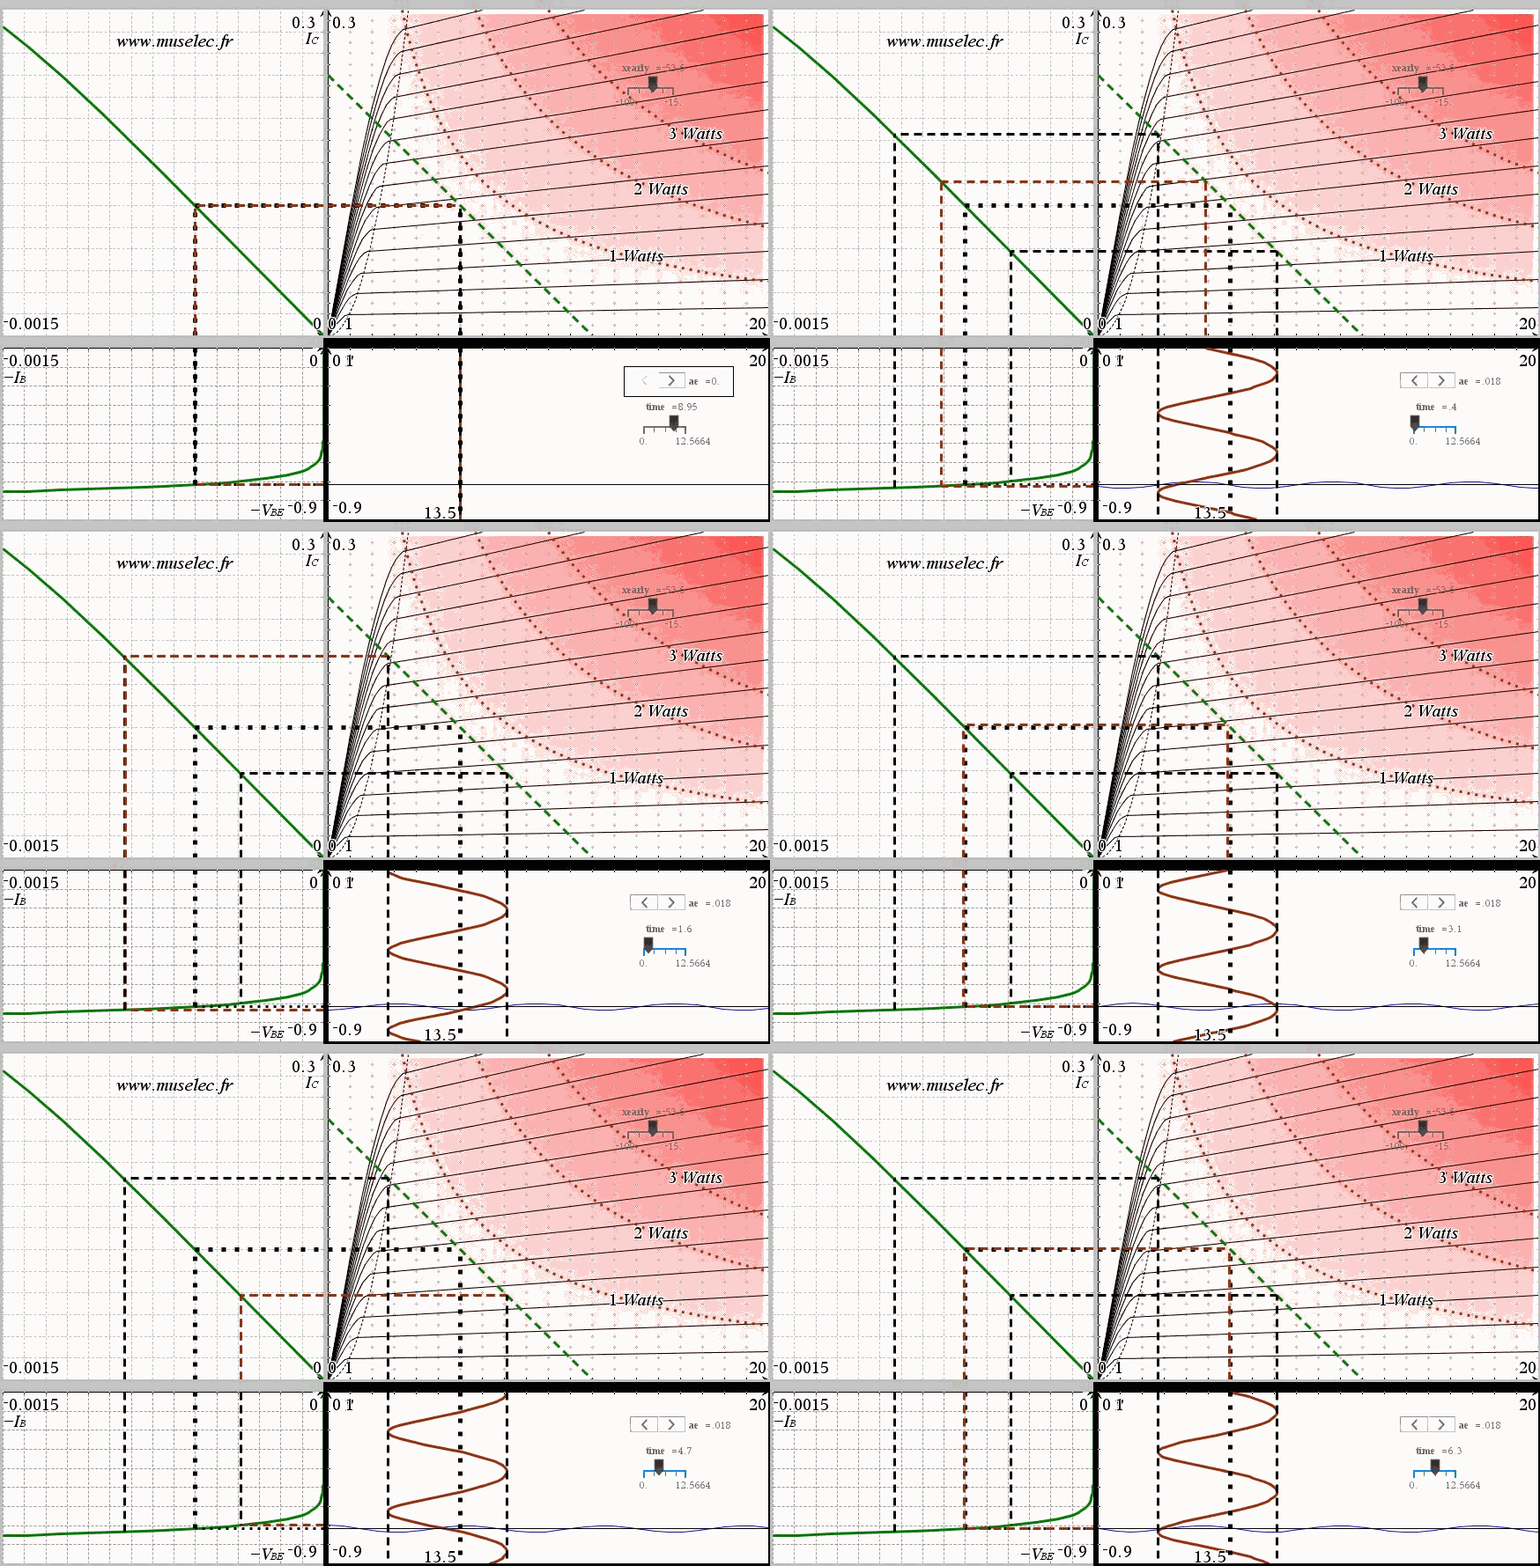
PNP commun emitter amplifier. One can see the distorsion of the output waveform because of the base characteristic exponential shape.
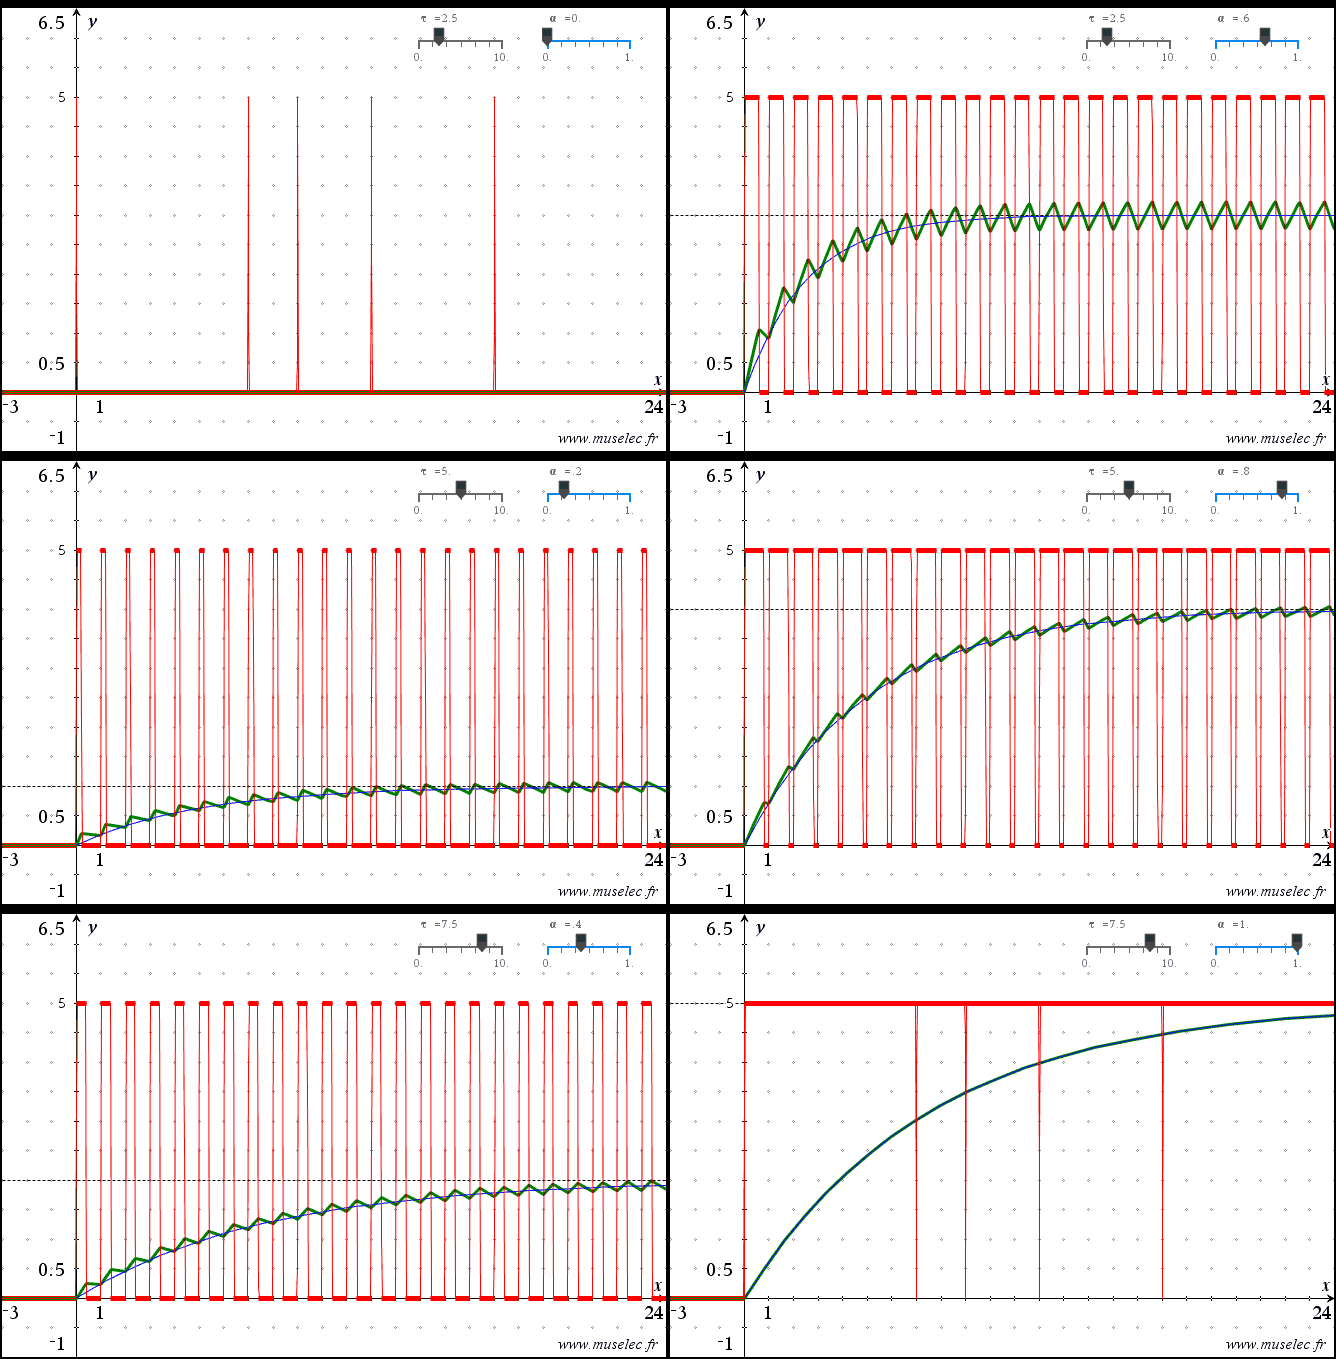
Response of an RC circuit to a PWM signal.
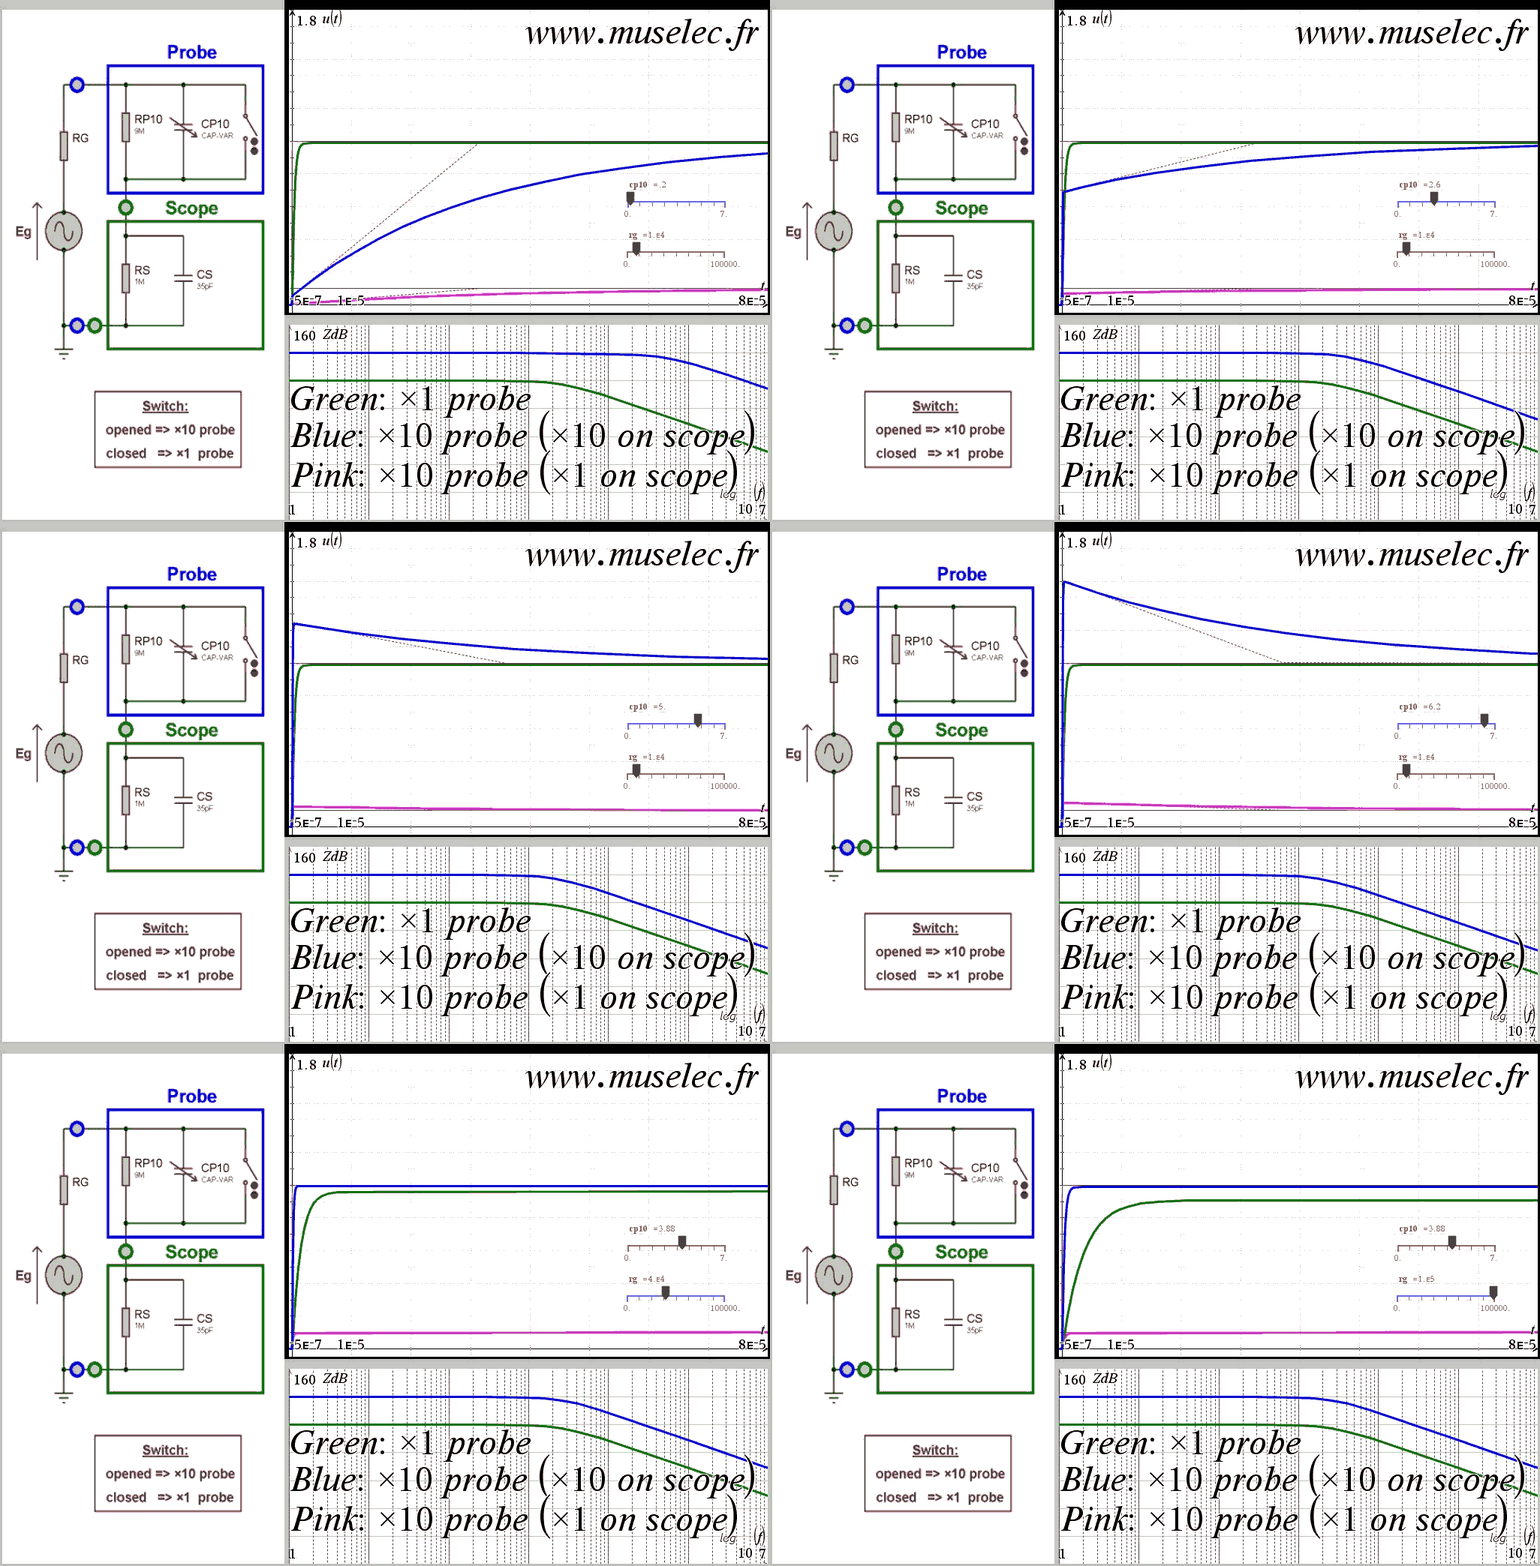
Adjusting a ×10 Probe in order to get correct response. (the ration between CP10 and Cs must be the same as the ratio between Rs and RP10)
CP10 is in picoF.
Note that:
*) the impedance is ×10
*) the bandwidth is ×10
but...
*) the static gain is /10
So: one have to specify on the scope the kind of probe that being used.
(Eg; Rg) is the simplest model you can use for where you put your probe on. One can see how much it can reduce the fastness and cause static error. With a ×10 probe, the fastness and static precision are 10 times less affected.
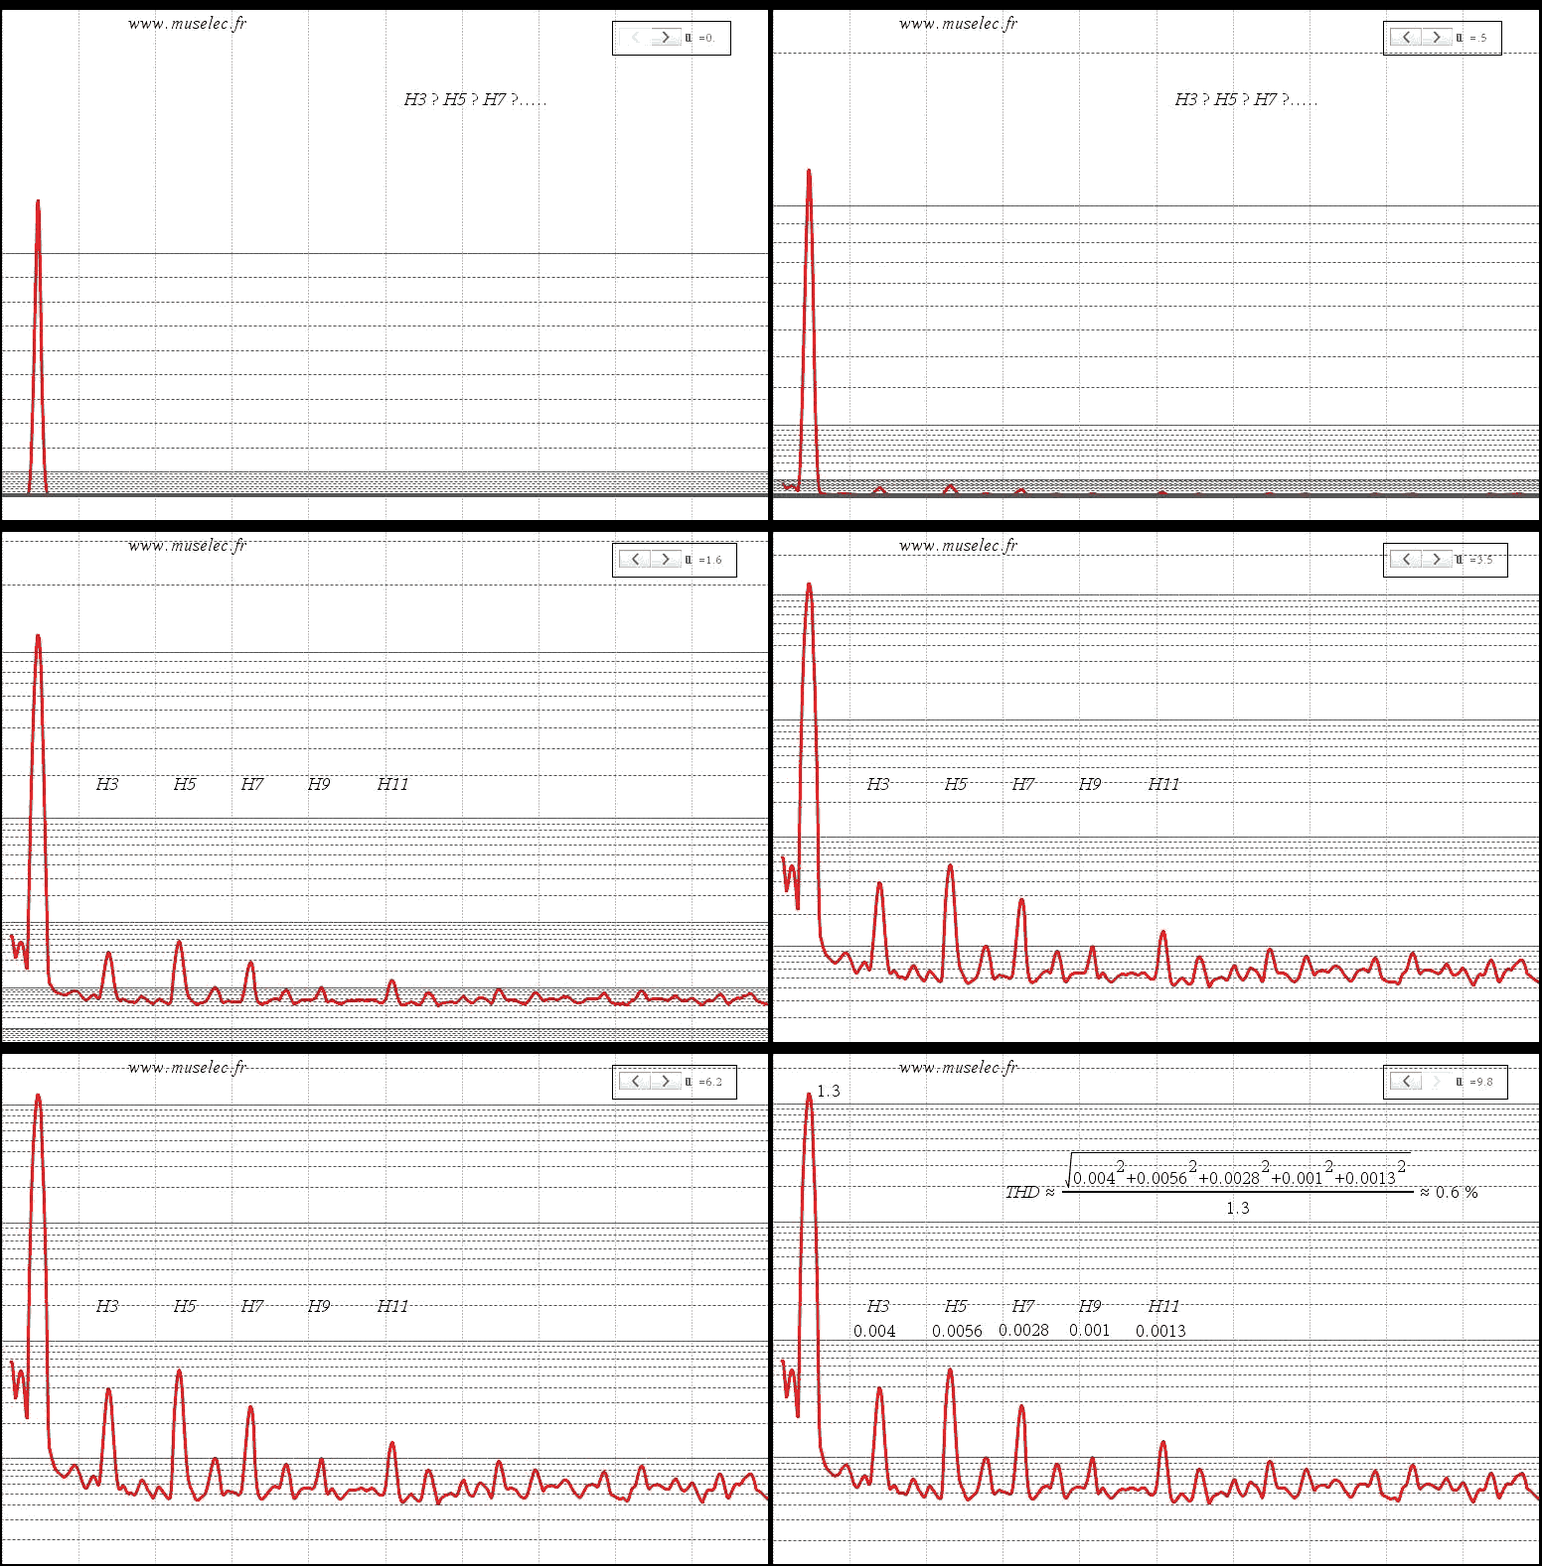
Spectrum of an XR2201.
This animation intends to show how log scaling, compared linear scaling, allows to see low level harmonics, so that one can estimate the THD.
This animation intends to show how log scaling, compared linear scaling, allows to see low level harmonics, so that one can estimate the THD.
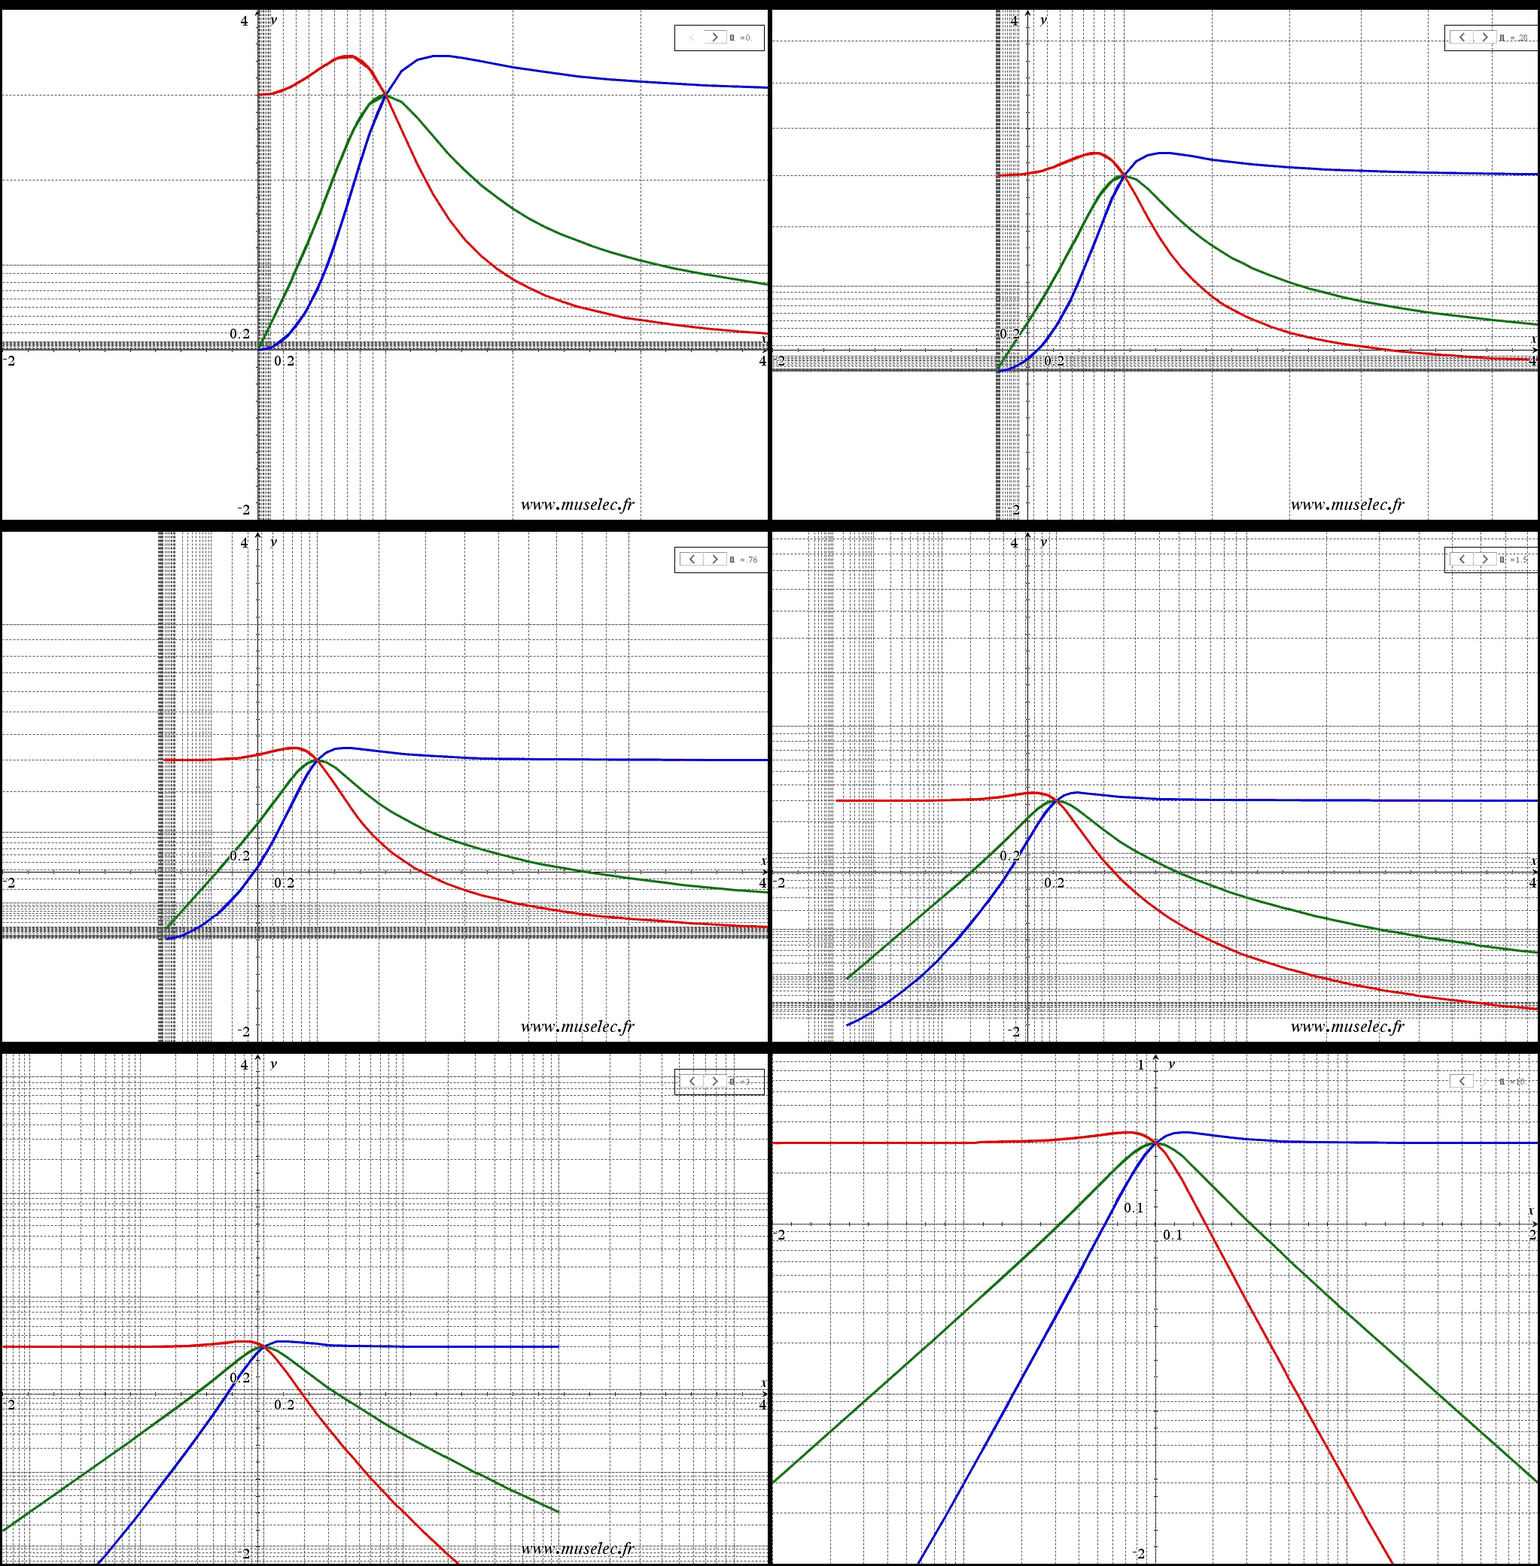
Universal filter:
*) Red: Low-pass
*) Green: Band-pass
*) Blue: high-pass
This animation intends to show how log-log scaling transform any power of x into straight lines.
*) Red: Low-pass
*) Green: Band-pass
*) Blue: high-pass
This animation intends to show how log-log scaling transform any power of x into straight lines.
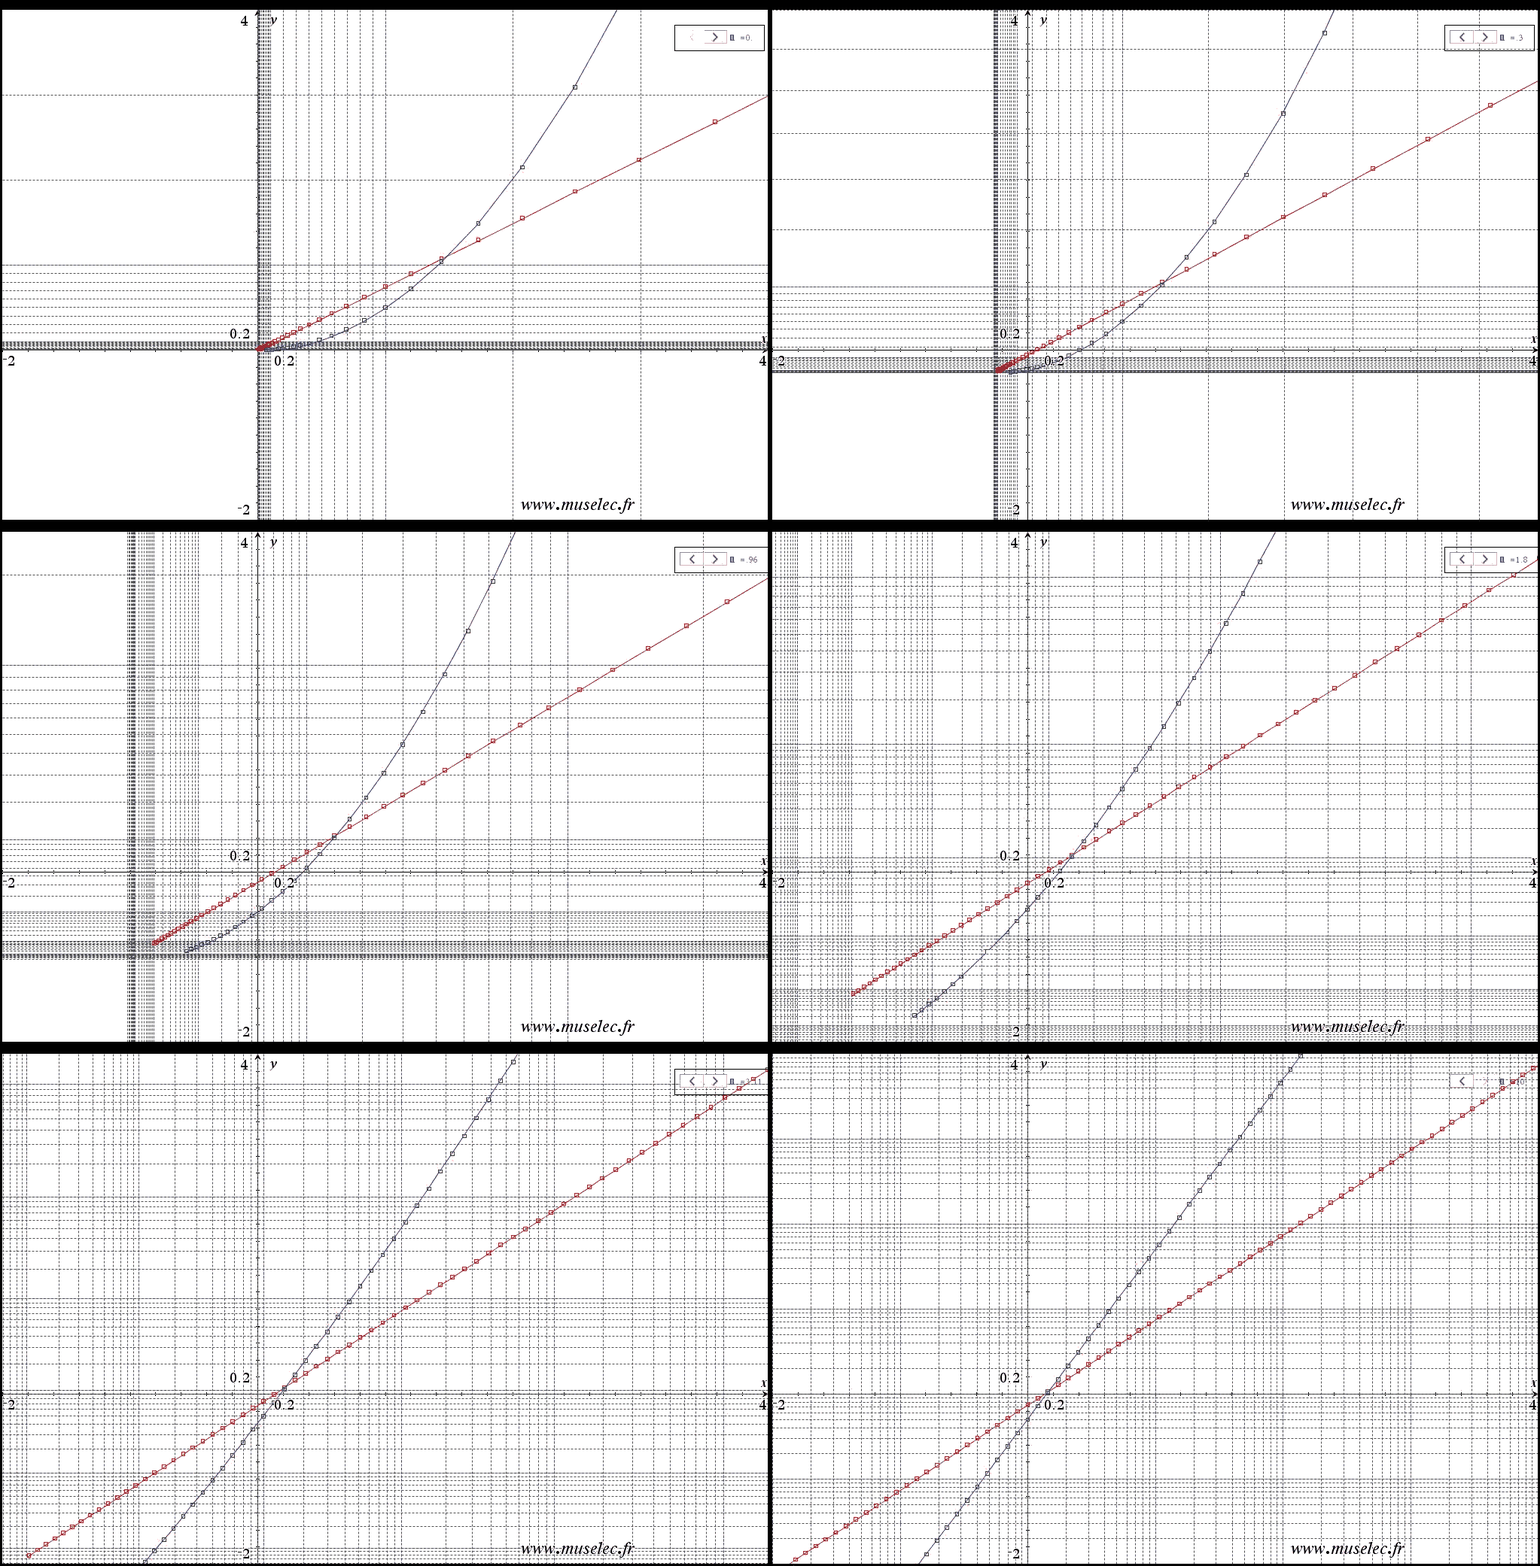
Log scale interest concerning component's characteristics...
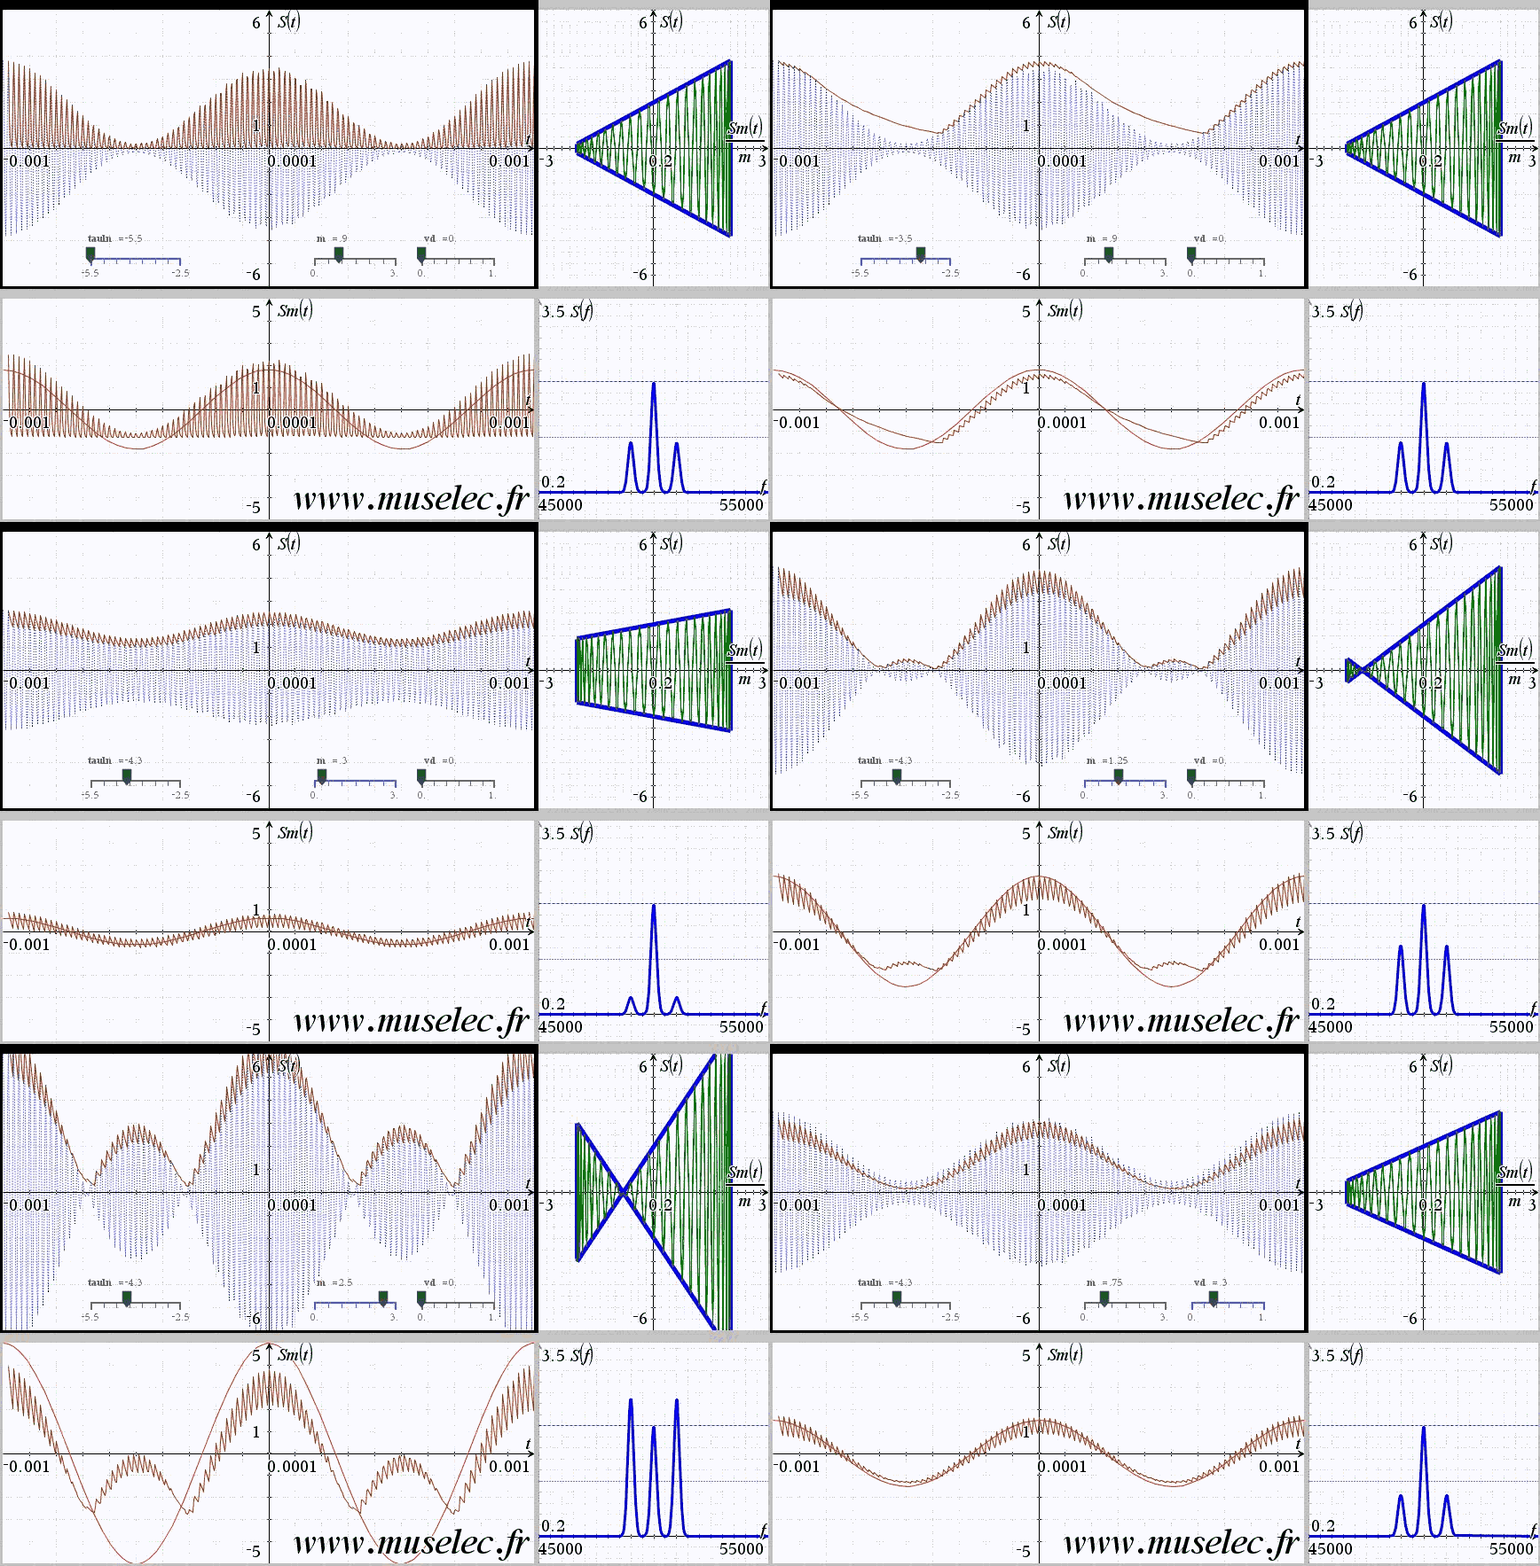
AM signal's demodulation: peak detect method.
s(t)=2*(1+m*cos(2*pi*1000*t))*cos(2*pi*50000*t)
RC=10^tauln
This animation intends to show the constraints of this method with respect to:
=> RC
=> m
=> Vd
s(t)=2*(1+m*cos(2*pi*1000*t))*cos(2*pi*50000*t)
RC=10^tauln
This animation intends to show the constraints of this method with respect to:
=> RC
=> m
=> Vd
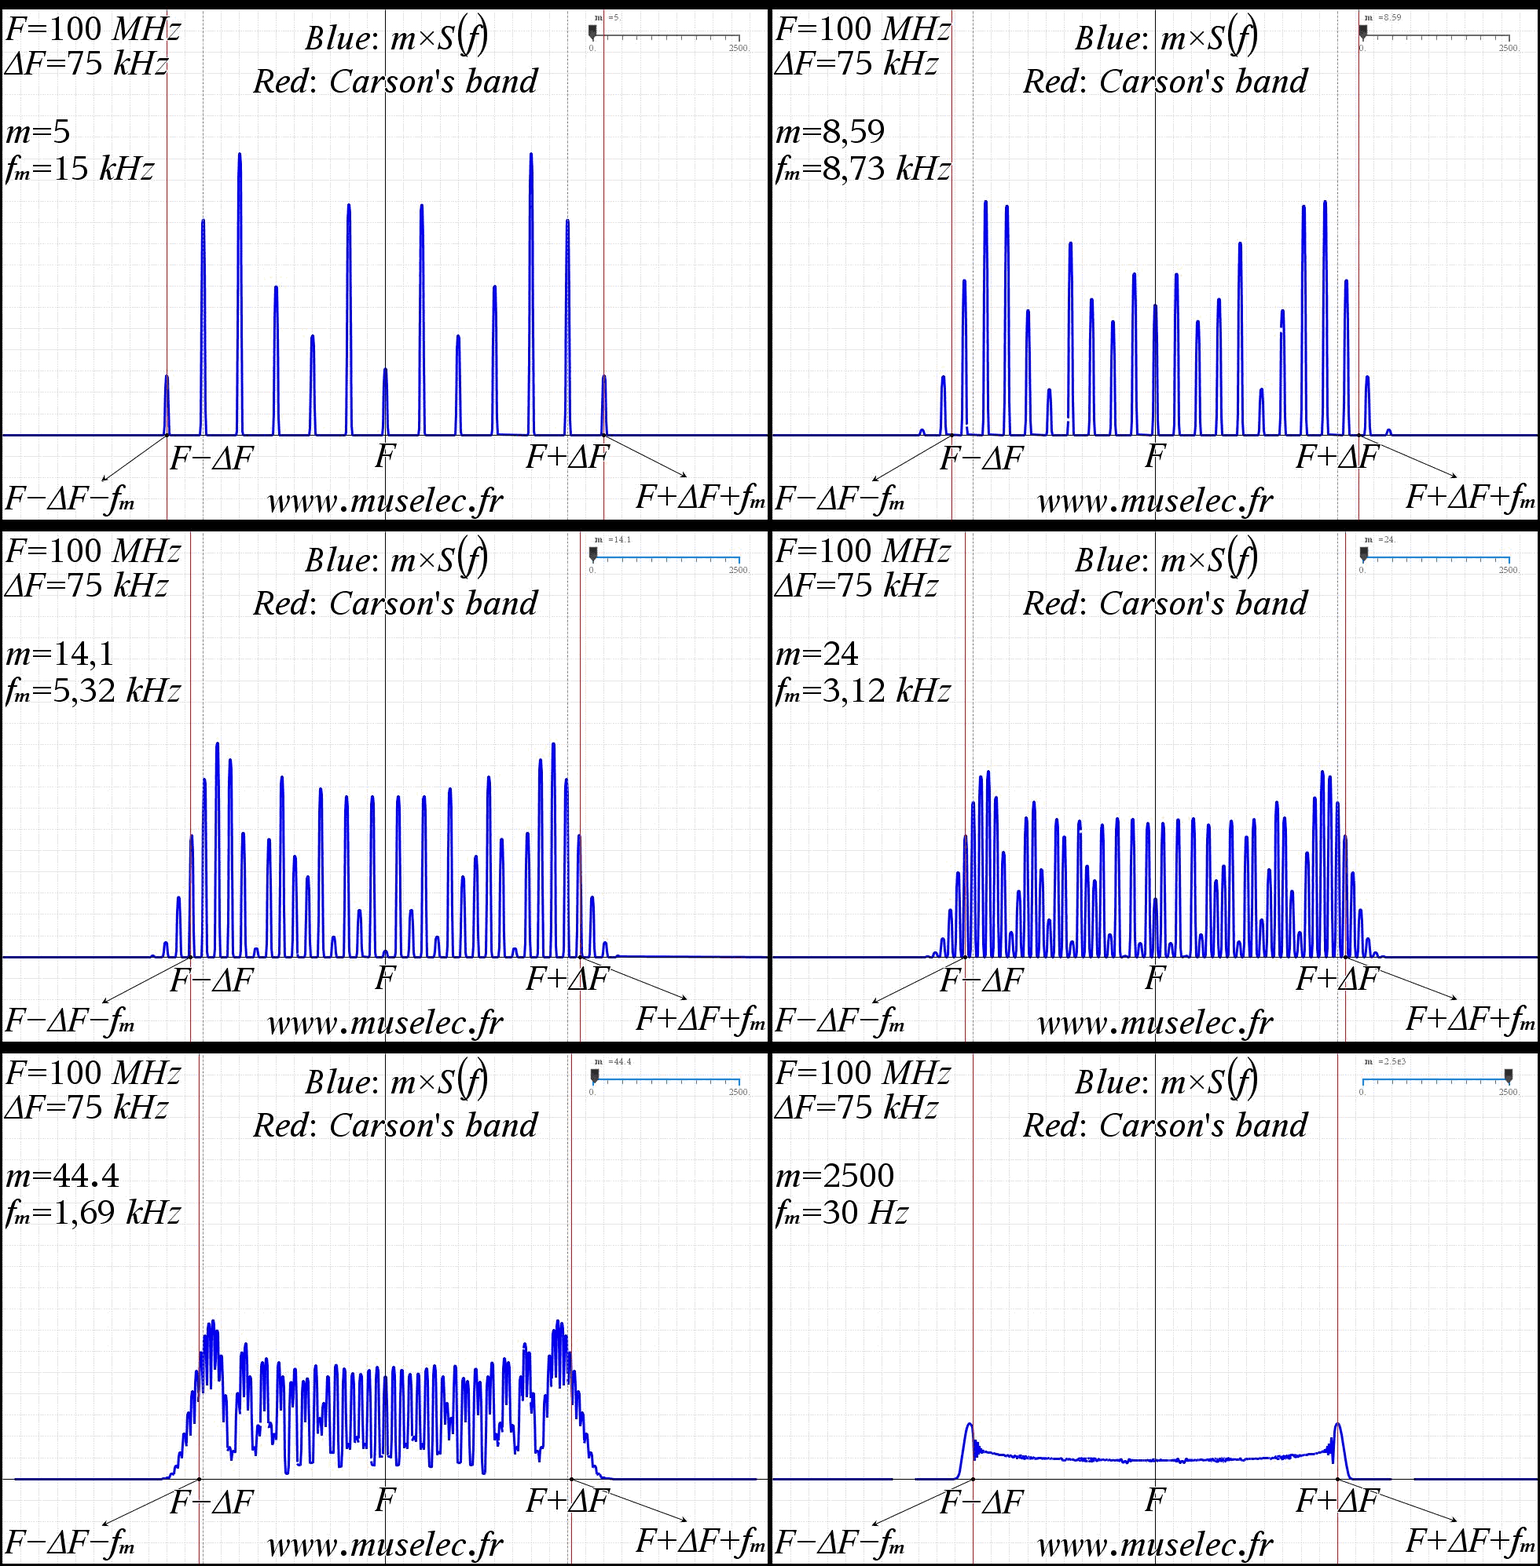
SPECTRUM OF A FREQUENCY MODULATED RADIO STATION:
Everyone knows you have to use Bessel's functions...but in pratice Bessel's functions are uncomputable when m and n grow...so I had to perfom an approximation of Bessel's functions....not that relialable for m > 100.
Everyone knows you have to use Bessel's functions...but in pratice Bessel's functions are uncomputable when m and n grow...so I had to perfom an approximation of Bessel's functions....not that relialable for m > 100.